Scorecard
(v1.0.0)
CopiedCopy the link
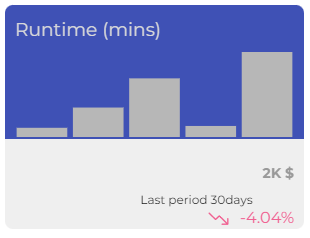
Description 🔥
Scorecard lets you display a summary of a single statistic. They are typically used to visualize key performance indicators, certain variables measuring the relative health or performance of your business or industry..
Styling 🎨
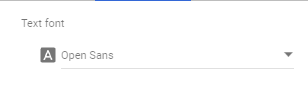
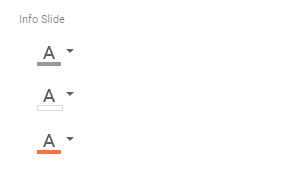
1- You can modify the font :
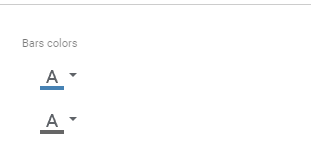
2- You can modify barchart color and text color
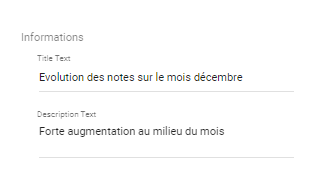
3- The displayed text after you click on the + button can be modified
4- Cross background color & color can be change + slide background
Data
Accepted formats
| labels | format |
|---|---|
| Dimension | YYYYMMDD |
| Metrics | Number |
Example
| date | Runtimes |
|---|---|
| 20221202 | 12000 |
| 20221203 | 5700 |
| 20221202 | 360 |