Funnel chart
(v1.0.0)
CopiedCopy the link
Description 🔥
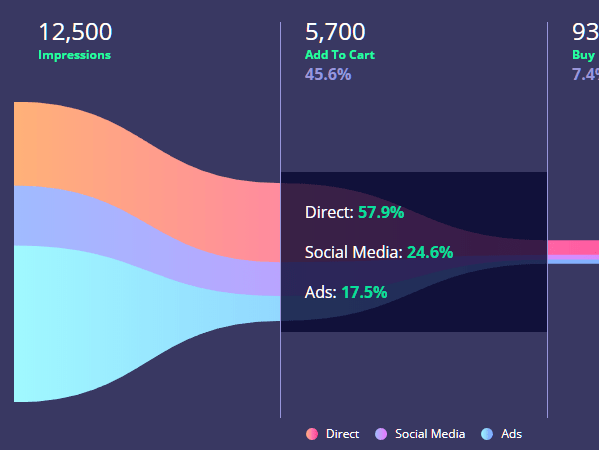
Funnel charts are a type of chart, often used to represent stages in a sales process and show the amount of potential revenue for each stage. This type of chart can also be useful in identifying potential problem areas in an organization’s sales processes. A funnel chart is similar to a stacked percent bar chart (wiki-source).
Styling 🎨
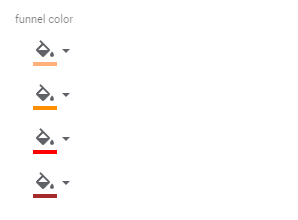
1- You can modify the funnel color:
If there is no "Sublabel" then, you can update only the first color.
Sublabel data can only have up to 4 distinct values
2- You can modify text color:
3- You can modify the slide (button +):
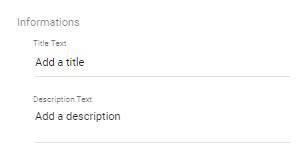
4- You can modify info about the chart:
5- You can update the font:
Data
Accepted formats
| labels | format |
|---|---|
| Dimension | string |
| Metric | number |
Example
| labels | sublabels | effectif |
|---|---|---|
| Impressions | Direct | 2000 |
| Impressions | Social Media | 4000 |
| Impressions | Social Media | 500 |
| Impressions | Ads | 6000 |
| Add To Cart | Direct | 3000 |
| Add To Cart | Social Media | 1000 |
| Add To Cart | Ads | 1700 |
| Buy | Direct | 200 |
| Buy | Social Media | 30 |
| Buy | Ads | 130 |
| Send | Direct | 50 |
| Send | Social Media | 10 |
| Send | Ads | 5 |